
ABSTRACT
POSTER SESSION
- 'An investigation on Twitter use of researchers: user type classification and text analysis'
Yui Arakawa (Graduate School of Library Information and Media Studies, University of Tsukuba)
Ryosuke Yoshimoto (Graduate School of Library Information and Media Studies, University of Tsukuba)
Fuyuki Yoshikane (Faculty of Library, Information and Media Studies, University of Tsukuba)
Takafumi Suzuki (Faculty of Sociology, Toyo University)Gathering information from social media content is becoming increasingly popular. Twitter, a microblog where posts are limited to 140 characters, is an excellent platform for instant and interactive information gathering. Many studies have focused on the role of Twitter in propagating information and spreading rumors (Miyabe et al., 2013; Yamamoto et al., 2012). Other studies have attempted to differentiate between tweets on the basis of genders, number of retweets, and other latent attributes (Arakawa et al., 2012; Burger et al., 2011; Rao et al., 2010). However, there has been less emphasis on the analysis of Twitter posts to obtain information specialized to specific domains. Such analysis could enable simple and rapid identification of information related to state-of-the-art technology.
This study reports preliminary analysis of Twitter posts to obtain domain-specific information. We examine the Twitter user profiles of specialists such as academic researchers and investigate the textual characteristics of their "tweets." We first downloaded 11,900 randomly sampled tweets and 11,577 tweets that were posted by specialists using the Twitter API from July 3, 2012 to August 19, 2012. We manually examined the profiles and applied MeCab (code.google.com/p/mecab) for morphological analysis. We applied random forests machine learning (Breiman, 2001) to classify the randomly sampled tweets and those by specialists, and to extract the distinctive features that influence the classification. We used bag-of-words, number of characters, number of replies (@), number of retweets (RT and QT), number of hash tags (#), number of URLs, and relationship with respondents (whether the respondents were their followers or not) as the features. We evaluated the results of the classification experiments using precision, recall rates, and F1 values (Tokunaga, 1999). We also evaluated the importance of the variables by random forests (Breiman, 2001).
The results of the profile analysis show that most academic researchers use their real names on their profiles and that their positions and affiliations are diverse. The results of random forests classification experiments show that we obtain more than 95% of precision, recall rates, and F1 values. They also show that citation marks (「」), relationship with respondents, and functional expressions such as "toiu" and "nitsuite" are some of the important features. These results indicate that tweets posted by specialists have characteristics that distinguish their tweets from those of others. With qualitative analysis, we conclude that many specialists tweet about their individual activities, education, or researches, and their tweets contain domain-specific knowledge and have identifiable textual characteristics. This study provides basic findings that can be applied to obtain domain-specific knowledge from Twitter. In future, we will explore development of an automated knowledge extraction system for Twitter posts focusing on a specific domain.
[Key Words: computational stylistics, research activities, text analysis, text mining, Twitter]
References
Arakawa, Y. et al. (2012) Stylistic analysis of tweets that are likely to be shared, JADH2012 Conference Abstracts, 48.
Breiman, L. (2001) Random forests, Machine Learning, 45(1), 5–23.
Burger, J. D. et al. (2011) Discriminating gender on twitter, Proceedings of EMNLP2011, 1301-1309.
Tokunaga, T. (1999) Jouhou Kensaku to Gengo Shori, University of Tokyo Press, Tokyo.
Miyabe, M. et al. (2013) Characteristic analysis of rumor and correction texts on microblog, IPSJ Journal, 54(1), 223-236.
Rao, D. et al. (2010) Classifying latent user attributes in twitter, Proceedings of SMUC2010, 37-44.
Yamamoto, M. (2012) Information propagation network for 2012 Tohoku earthquake and tsunami on twitter, Joho Syori, 53(1), 1184-1191. - 'Validation of Hierarchical Rhetorical Structure by Combination of Quantitative Evaluation and Traditional Rhetorical Analysis'
Hajime Murai (Assistant Professor, Tokyo Institute of Technology)
In order to interpret the Bible precisely, literary criticism is a promising field. It is a methodology for analyzing the Bible as literature and its use of literary techniques. A marked literary characteristic of the Bible is its sophisticated structures, which comprise classic rhetorical structures such as chiasmus, concentric structures, and parallelisms.
There are several merits to identifying rhetorical structures in the Bible. It can clarify the divisions in a text; moreover, correspondences of phrases in them signify deeper interpretation. If the rhetorical structure is the concentric structure, the main theme of that text is also clarified.
However, there are some problems regarding rhetorical structures.
First, there is no clear definition regarding what is a valid correspondence. Some structures correspond by words or phrases, but more abstract themes may also be the element of correspondences. The length of the text unit is not uniform. Some structures are composed of phrases while other structures are composed of pericopes (periscope is a unit of short story in the Bible). Therefore, a quantitative validation method for the rhetorical structure of the Bible is necessary.
In this research, two approaches are combined to validate a hypothesis of a hierarchical rhetorical structure of the Bible. One approach is quantitative evaluation of contingency of a hypothesis. In quantitative evaluation approach, at first the relationships between each part of the text in the rhetorical structure are validated on the basis of the common occurrence of rare words and phrases. At second, the probability of accidental occurrences of common words and phrases in the test hypothesis is calculated. In this approach, two types of random patters are evaluated. One is random combination of pericopes, and the other is random division of pericopes. Three types of random patterns (random combination, random division, and both random) are compared with the test hypothesis and statistical significances are calculated. As a result, rhetorical structures of all long books of the Bible are statistically validated in several types of random patterns.
The second approach is traditional rhetorical analysis by human knowledge. The validity of test hypothesis can be quantitatively calculated by compared with random patterns, but if texts were divided intentionally to make more pairs of rare words and phrases, it may be validated wrongly. Therefore the validity of text division should be examined by some other methodology. In the test hypothesis of hierarchical rhetorical structure, rhetorical structures of whole text size are composed of pericopes. Also those pericopes are basically composed of some type of rhetorical structures (chiasmus, parallelisms, and concentric structure). Then validity of division of text is examined by analysis of pericope level rhetorical structures.
As a result, divisions of pericopes in test hypothesis were validated because some rhetorical structure or some type of rhetorical unit was found in basically all hypothetical pericope.
Though the result of this research is eclectic, those extracted rhetorical structures within pericopes might be quantitatively evaluated in the next step.[Key Words: Rhetorical Structure, Bible, Chiasm, Quantitative Analysis]
- 'Workset Creation for Scholarly Analysis: Preliminary Research at the HathiTrust Research Center'
J. Stephen Downie (Professor and Associate Dean, Graduate School of Library and Information Science, University of Illinois at Urbana-Champaign)
Tim Cole (Professor and Math Librarian, University of Illinois at Urbana-Champaign)
Beth Plale (Professor of Computer Science, School of Informatics and Computing, Indiana University)
John Unsworth (Vice Provost for Library and Technology Services, Chief Information Officer and University Librarian, Brandeis University)Scholars rely on library collections to support their scholarship. Out of these collections, scholars select, organize, and refine the worksets that will answer to their particular research objectives. The requirements for those worksets are becoming increasingly sophisticated and complex, both as humanities scholarship has become more interdisciplinary and as it has become more digital.
The HathiTrust is a repository that centrally collects image and text representations of library holdings digitized by the Google Books project and other mass-digitization efforts. The HathiTrust corpus contains some 10 million volumes comprising over 3 billion pages. The HathiTrust's computational infrastructure is being built to support large-scale manipulation and preservation of these representations, but it organizes them according to catalog records that were created to enable users to find books in a building or to make high-level generalizations about duplicate holdings across libraries, etc. These catalog records were never meant to support the granularity of sorting and selection or works that scholars now expect, much less page-level or chapter-level sorting and selection out of a corpus of billions of pages.
The ability to slice through a massive corpus consisting of many different library collections, and out of that to construct the precise workset required for a particular scholarly investigation, is the "game changing" potential of the HathiTrust; understanding how to do that is a research problem, and one that is keenly of interest to the HathiTrust Research Center (HTRC), since we believe that scholarship begins with the selection of appropriate resources.
Given the unprecedented size and scope of the HathiTrust corpus—in conjunction with the HTRC's unique computational access to copyrighted materials—we are beginning a project that will engage scholars in designing tools for exploration, location, and analytic grouping of materials so they can routinely conduct computational scholarship at scale, based on meaningful worksets.
"Workset Creation for Scholarly Analysis: Prototyping Project" (WCSA) seeks to address three sets of tightly intertwined research questions regarding:
1) enriching the metadata describing the HathiTrust corpus through mining of the resources themselves and leveraging end-user annotations;
2) augmenting string-based metadata with URIs to leverage external services and Linked Open Data to facilitate discovery and the process of organizing HathiTrust resources into collections and worksets; and,
3) formalizing the notion of collections and worksets in the context of the HathiTrust Research Center.Building upon the model of the Open Annotation Collaboration, the HTRC is engaging with the digital humanities community to begin development of tools and refine requirements and priorities for enriching and augmenting metadata for the HathiTrust corpus. Concurrently, the HTRC is working closely with the Center for Informatics Research in Science and Scholarship (CIRSS) at the University of Illinois to develop and instantiate a set of formal data models that will be used to capture and integrate the outputs of the funded prototyping projects with the larger HathiTrust corpus.
[Key Words: Collection building, Content analysis, Metadata, Linked open data, Formal models]
- 'Geographical structure of medical delivery in Kyoto, Tokugawa Japan: a historical GIS analysis on the distribution of medical practitioners'
Mamiko Mataza (JSPS Research Fellow, Ritsumeikan University)
Akihiro Tsukamoto (Associate Professor, The University of Tokushima)
Tomoki Nakaya (Professor of Geography, Ritsumeikan University)This study explored the geographical placement of medical practices in Kyoto during the early modern age—the Tokugawa period (early 17th to mid-19thcentury)—based on spatial and temporal distributions of medical practitioners.
Geographical Information Systems (GIS) were originally ill-suited for analyzing historical data. It was not until the 21st century that Historical GIS research in Japan developed both in terms of methodology and database creation (Japan Council for Historical GIS Research 2012).We applied the Historical GIS approach to medical delivery and health care in past Japanese societies.
Since Kyoto enjoyed the most advanced medicine until the 18thcentury, large sets of historical material with detailed information of medical practitioners' addresses remained. Data were obtained from various topographies and directories published during that time. Although the importance of such material has been recognized by Japanese historians, previous studies failed to present meaningful results about geographical aspects (for instance, Kyoto Medical Association 1980: Umihara 1999). There is only one map, based on the directory with a preface written in 1843, aboutthe Distribution of Medical Practitioners (Kyoto City 1973).
The methodology of the study is as follows. We built a database of medical practitioners which included names and addresses based on records published between 1685 and 1867. Data were mainly from the "Kyoto topographies database" (http://www.dhjac.net/db1/books/kyofu/index.html). Other sources were various administration documents and directories. Ten resources were selected from the database from different time-periods, with about 20-year intervals, and maps were drawn of the geographical distribution of medical practitioners by specialty categories (e.g. surgery). As addresses in Kyoto were commonly referred to by a combination of north-south and east-west street names, medical practitioners' addresses from the 10 resources were geocoded using the Historical GIS database of Kyoto streets (Kirimura, Tsukamoto, Yano 2009). This is the application of a method linking attribute data (hold x and y co-ordinates) to spatial data (Gregory & Ell 2007).
Results revealed that medical practitioners were not geographically clustered; other occupation groups tended to concentrate in a few specific areas. The type of medical profession was not the determining factor; rather, it was whether they served lords, especially the Imperial Court, that influenced geographic distribution. In the late 17thcentury, many practitioners, serving the Imperial Court and Shogunate, resided near the Imperial Palace. General practitioners serving regular citizens steadily increased thereafter, and came to serve both lords and the public. In the last days of Tokugawa Shogunate, medical practices near the residences of political people rapidly increased; which indicates that at the beginning and end of the Tokugawa period, power impacted on the practices to some degree. Many practitioners, however, tended to provide medical services on major avenues. A researcher notes that practices were opened along prosperous commercial and industrial area (Moriya 1978). This indicates that medical practitioners took account of the geographical locations of their medical practice as an important aspect in their management strategy. Importantly, our results suggest that medical practitioners of good reputation were allowed to decentralize through the city and lords did not monopolize them in the early modern age of Kyoto.[Key Words: GIS, Archive database, Kyoto, early modern, Medical practitioner]
References
Gregory, I. N., & Ell, P. S. (2007). Historical GIS: Technologies, Methodologies and Scholarship. Cambridge, London: Cambridge University Press.
Japan Council for Historical GIS Research. (2012). Historical GIS Perspectives in Japan. Tokyo: Bensei Shuppan (Ed.).
Kyoto Medical Association. (1980). Kyoto no igakushi [The history of medicine in Kyoto]. Kyoto: Shibunkakushuppan (Ed.).
Kyoto City. (1973). Kyoto no rekishi [The history of Kyoto], 6. Tokyo: Gakugeishorin (Ed.).
Moriya, K. (Ed.). (1978). Kyouishi no rekishi [The history of doctors in Kyoto]. Tokyo: Kodansha.
Kirimura, T, Tsukamoto, A, Yano, K. (2009). Building a spatiotemporal database of street names in Kyoto, IPSJ symposium series, v.2009, no.16, 331 – 338.
Umihara, R. (1999). Juuhachiseiki ranpouigaku no tenkai to sono syakaitekieikyou [The development and social influence of Dutch medicine in the 18th century]. Annals of the Society for the History of Western Learning in Japan, 8, 287–301. - 'Corrective-Detective Features in the Ongoing Finnegans Wake Genetic Research Archive Project'
Mikio Fuse (Professor, Department of English, University of the Sacred Heart)
Asanobu Kitamoto (Associate Professor, National Institute of Informatics)In our Finnegans Wake Genetic Research Archive Project (started April 2012) we have adopted the TEI rules on digitizing the different kinds of documents involved in the genesis of the book and, using Perl and XSLT for data manipulation, created a prototype of the archive. Diversity of the documents involved and complexity of the irinter-relationship* have been a big challenge to the digital archiving project in general and to the adoption of TEI standard in particular, but so far so good, as far as the basic matters of data storage and basic document views are concerned. Now we are on the second strand of the project to considerhow to make it a practically and sustainably useful tool for Finnegans Wake genetic studies.
A crucial point to remember in creating this archive is that it can never be complete. Once the data is digitally installed, currently available data and their inter-relationship always have a huge potential of instigating a discovery of new related document to be newly included in the archive, or of revising the analysis of the relationship of old and new document data. There is also the more common problem of errors and uncertainty of the available data, which often prove correctible and clarifiable by close analysis of the related document data collectively. That is what makes the "corrective-detective" features an essential consideration of our archive. In the proposed poster presentation we should like to demonstrate a couple of "corrective-detective" features of the archive we have been developing.
The archive prototype is being built with Notebook VI.C.2 as a cornerstone because it involves one of the most complex constellations of Finnegans Wake textual genetics. It is an amanuensis copy (and a considerably inaccurate one at that) of those units of Joyce's authorial Notebooks VI.B.34, VI.B.2, VI.D.2 and VI.B.6 which he did not cross out in colour crayons (to mark that he has used them in Notesheets and Manuscripts). Of the four parent notebooks of VI.C.2, Notebook VI.D.2 is not extant but can be restored, at least partially (and imperfectly), through analysis of VI.C.2, because, with the considerably inaccurate VI.C.2 entries as clues, we can expect to discover new book or newspaper article Sources from whose words and passages Joyce is supposed to have created the units in the lost Notebook VI.D.2. Once the parent Sources are identified, we can restore the original uncrossed-out units of VI.D.2 by "correcting" the amanuensis' errors in VI.C.2. We can also hope to restore those original VI.D.2 units that were crossed-out (and therefore not copied onto Notebook VI.C.2) by extensive analyses of Joyce's overall patterns of the usage of individual Notebooks in different draft-levels of Notesheets and Manuscripts. By this methodology we have a fair chance of partially restoring both the uncrossed-out and crossed-out unitsof the lost Notebook VI.D.2.
The poster presentation would demonstrate how the archive is designed to positively help the researcher discover new Sources and correct/clarify (or restore) erroneously/uncertainly transcribed (or simply lost) Notebook units.
[Key Words: TEI, digital archive, James Joyce, Finnegans Wake, genetic criticism]
*Note: Joyce gathered verbal and conceptual materials for his composition as he readall the miscellaneous books and newspaper articles (Sources) and jotted them down in his Notebooks (B series if extant and D series otherwise). At some stage Joyce also started to ask his amanuensis, Mme. Raphael, to copy the uncrossed-out entries of his authorial Notebooks onto scribal Notebooks (C series). Whether authorial or scribal, the Notebook entries were later transferred to Manuscripts, either directly or via extra-draft Notesheets.
- 'The Contemporary Wayang Archive: A Digital Inquiry into the Ethics and Aesthetics of a Theatre Tradition'
Miguel Escobar (PhD Candidate at the National University of Singapore)
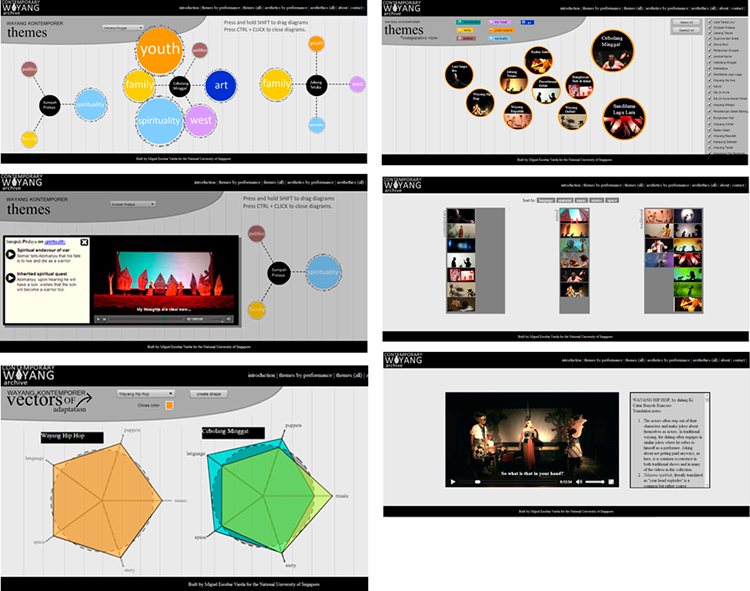
The Contemporary Wayang Archive is a research project aimed at studying a theatre tradition in Indonesia by combining digital research tools, Performance Studies methodologies and an ethnographic approach. The outcome of the research will eventually be presented through a website that includes fully annotated and translated videos of twenty four performances. It also includes different interactive visualizations that allow the users to explore the aggregated data generated from the annotations. These visualizations are linked to time-coded video recordings and to longer ethnographic descriptions. This hybrid presentation style aims at providing both a visual overview of the key research findings and longer, in-depth explanations of the context and specificities of each performance.
These digital tools are particularly fitting to the tradition being studied. Wayang Kulit is the most respected performance tradition in Indonesia, but this research concentrates on radical re-elaborations of this form in the past 15 years. These are analyzed in terms of their intermedial aesthetics (the way they use new media in combination with tradition) and of their post-traditional ethics (the way they explore changing sociocultural norms).
Despite some similarities, all the performances deploy very different aesthetic strategies and address a variety of issues. This research project aims to compare and contrast these performances and offer an interpretation about what they collectively convey about sociocultural change in contemporary Java. Following a conventional approach in Theatre and Performance Studies, each of the performances was analyzed in terms of their formal qualities and their thematic content, offering explanations of cultural, political and historical references, and developing interpretations of the philosophical and social meaning of the stories. This analysis was supported by a series of time-coded annotations linked to the videos. The annotations were then compared and contrasted along different dimensions in order to explore differences and similarities among the performances. Then, the annotations were clustered around several aesthetic dimensions (music, space, actors, language and stories) and ethical themes (such as family, politics and spirituality). In the website that will make the research findings available, the resulting analysis can be accessed in two ways: • As a series of more conventional essays linked to relevant segments of the videos, where the performance analysis is supplemented by ethnographic descriptions of the ways each performance was received in a Javanese context. • Through interactive visualizations generated from aggregating the annotations classified under different categories. Both modes are not mutually exclusive, since the visualizations are linked to the essays and videos. This project required an interdisciplinary approach and a combination of research activities. In order to complete it, I travelled through Java for eighteen months conducting interviews, collecting existing recordings and coordinating new recording efforts. I also edited, translated and annotated the videos and developed a JavaScript interface for the website. In this poster presentation, I will address the implications and possibilities of these mixed strategies, as an instance of DH research into Performance Studies and Anthropological studies of art.
Although the final version of this website is not yet publicly available, a computer with a working version will be available during the poster sessions.
[Key Words: Data Visualization, Video Annotation, Performance Studies, Visual Anthropology]
- 'Automatic Document Layout Analysis based on Machine Learning for Digitizing Japanese Historical Journals'
Katsuya Masuda (Project Researcher, Center for Knowledge Structuring, University of Tokyo)
Makoto Tanji (Project Researcher, Center for Knowledge Structuring, University of Tokyo)
Hideki Mima (Associate Professor, Affiliation: Graduate School of Engineering, University of Tokyo)This proposal presents an approach of digitizing historical documents especially a process of automatic document layout analysis, logical layout analysis and reading order estimation. Extraction of text from document images is needed for not-digitized historical documents since digitized text data enables more higher-level analysis in digital humanities. For example, new knowledge will be discovered from the results of processing the digitized texts with natural language processing and visualization. Our digitization system receives digital images of documents as inputs, and output the digitized text extracted from the images with logical roles, such as title, author and so on.
The flow of our automated digitization is as follows:
- Recognize the characters in document images with blocks and lines by using a commercially available optical character recognition (OCR) system.
- Estimate logical roles and reading order of blocks in OCR results
- Organizes each article by collecting up the blocks and outputs digitized text with logical rolesThe current target resource we deal with is a Japanese journal in humanities, "Shiso (Thought)." The journal has been published since 1921 until now and consists of more than one thousand of numbers, 10,000 articles, 190,000 pages. From the large digitized documents "Shiso," we expect to discover new knowledge of Japanese modern history of philosophy.
In the logical layout analysis step, we proposed a method to identify a logical role of blocks using machine learning technique. We adopted Support Vector Machine (SVM) as a classifier using various types of features of blocks in the OCR results, positions (x and y coordinate), black space length for four directions, block size, character size and linguistic features. The proposed approach were evaluated on the OCR data of "Shiso" documents. The approach classified blocks into five logical roles, "Title," "Author," "Header," "Page Number" and "Text Body," and achieved around 99% F-score in the experiments.
In the reading order estimation step, we introduced Page Splitting method to estimate reading order. The method splits a page vertically or horizontally into two areas which are split recursively until it reaches one block. The different split rule leads to different reading order. To learn the split rule, we used an machine learning optimization method DE (Differential Evolution), and various features, type of split, the number of blocks under a split line, position of a split line, width of a split and logical roles of blocks. Finally, all split blocks are organized using predefined orientation. Our method estimated reading order with about 0.04 of error (Spearman Distance). The experimental results for the two steps show enough accuracy for digitizing documents.
We constructed a "Shiso" textual database of 80 years from 1921 to 2000 by using our digitizing process, and we also installed it into the knowledge structuring system which is a retrieval system visualizing results in order to help users to discover new knowledge. Although current target is "Shiso," the digitizing process from digital images of documents can be applied to other targets with low cost to create data with correct logical roles manually for machine learning.
[Key Words: Text Digitizing, Document Layout Analysis, Optical Character Recognition, Machine Learning, Knowledge Structuring]
- 'Lexical Modeling of Yamabuki (Japanese Kerria) in Classical Japanese Poetry'
Hilofumi Yamamoto (Tokyo Institute of Technology / University of California, San Diego)
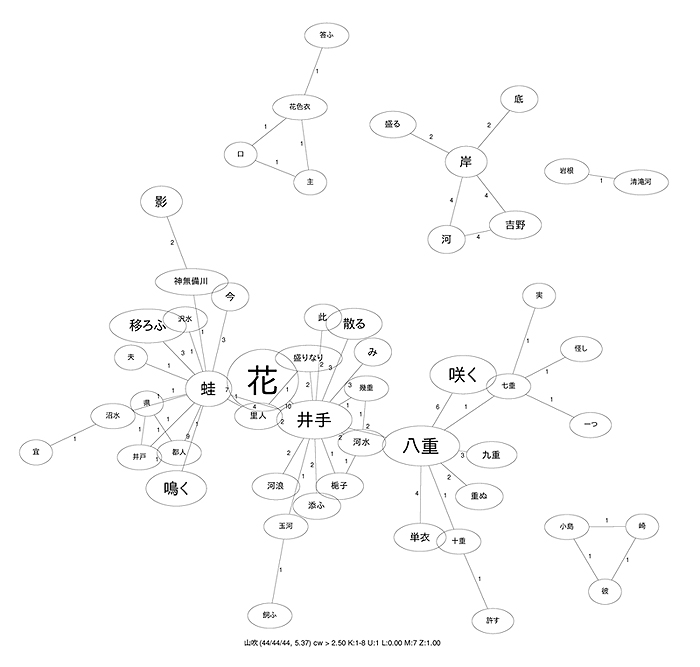
This project is a lexical study of classical Japanese poetic vocabulary through network analysis based on graph theory. The analysis is based on co-occurrence patterns, defined as any two words appearing in a poem.
Many scholars of classical Japanese poetry have tried to explain the constructions of poetic vocabulary based on their intuition and experience. As scholars can only demonstrate constructions that they can consciously point out, those that they are unconscious of will never be demonstrated. When we develop a dictionary of poetic vocabulary using only our intuitive knowledge, the description will lack important lexical constructions. In order to conduct more exact and unbiased descriptions, it is necessary to use computer-assisted descriptions of poetic word constructions using co-occurrence weighting methods on corpora of classical Japanese poetry.
We developed the corpora of classical Japanese poetry based on the eight anthologies compiled under imperial order called the "Hachidaishū" which were established from ca. 905 to 1205. We also developed a method of co-occurrence weighting (Yamamoto, 2006) which calculates the weight of patterns of any two words appearing in a poem sentence similar to the tf-idf method (Sparck Jones, 1972; Robertson, 2004; Manning and Schutze, 1999). The CW allows us to examine the patterns of poetic word constructions through mathematical models.
As a result, when we draw a network model from co-occurrence patterns, we can in general observe a main hub node derived from a topic word. Additionally, we also encounter other hub nodes which do not indicate topic words nor entry items in a poetic dictionary. For instance, when we take yamabuki (Japanese kerria) as a topic word and draw its network model, we will observe kahazu (frog), Ide (place name, proper name), and yahe (eightfold or double ower) as hub nodes. The terms yamabuki, kahazu, and Ide are contained in some poetic dictionaries as entry items or collocations. The term yahe is, however, not seen in any poetic dictionaries even as a single term. We conclude that a term such as yahe can be shown as a hub node which takes an important role to connect a topic word with other peripheral words such as kokonohe, nanahe, hitohe, and plays a supporting role to form a poetic story in the poem even if it is not included in a dictionary.
The finding of this study is that the modeling developed here allows us to 1) discern not only patterns described by experts but also patterns yet undescribed, and 2) identify not only specific or tangible words but also abstract or conceptual words which have a tendency to be left out of dictionaries.
[Key Words: corpus linguistics, co-occurrence weight, visualization, Japanese literature, network modeling]
References
Manning, Christopher D. and Hinrich Schutze (1999) Foundation of statistical natural language processing, Cambridge, Massachusetts: The MIT press.
Robertson, Stephen (2004) "Understanding inverse document frequency: on theoretical arguments for IDF", Journal of Documentation, Vol. 60, pp. 503-520.
Sparck Jones, Karen (1972) "A Statistical Interpretation of Term Specificity and Its Application in Retrieval", Journal of Documentation, Vol. 28, pp. 11{21. Yamamoto, Hilofumi (2006) "Konpyūta niyoru utamakura no bunseki / A Computer Analysis of Place Names in Classical Japanese Poetry", in Atti del Terzo Convegno di Linguistica e Didattica Della Lingua Giapponese, Roma 2005 : Associazione Italiana Didattica Lingua Giapponese (AIDLG), pp. 373-382. - 'Visualization of the constitution of written language on the web'
Makiko Harada (doctoral course of Graduate school of Tokyo Metropolitan University)
Hidenori Watanave (An associate professor of Tokyo Metropolitan University)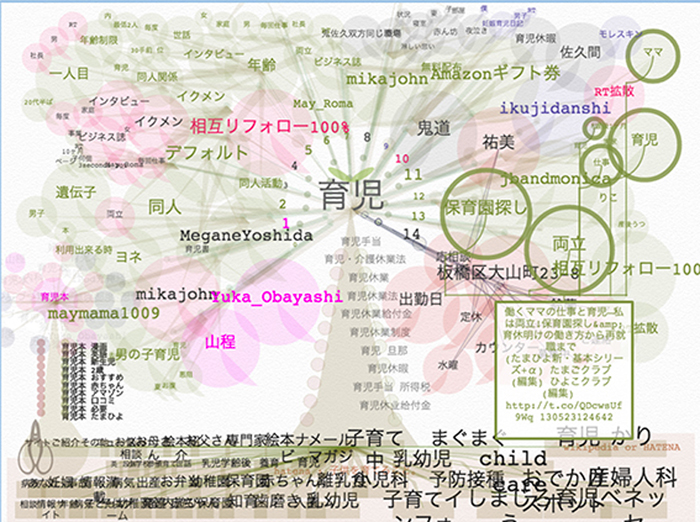
Fig 1:Tree of Language, or "Kotobanoki"The text on the Web consists of written languages, which reflect the emotions, lifestyles and environments of people from every walk of life. It is organized very differently from a dictionary. Studies have utilized network models to visualize relationships between words on the web. But we should point out that these studies have not paid due attention to the user's emotional state of mind and thus it is difficult to see in an intuitive way the background that gave rise to the context. We thought that the emotional context in the sentence is important to understand the real usage of the word. Also, these interfaces don't follow average people's usages.
The purpose of this study is to show average people the constitution of written language on the web. We visualize the relationship between words to reflect one's emotions, lifestyles and environments. The results are archived in a way in which you are able to see the constitution of the words in terms of chronology in a correlation chart. In order to achieve our purpose, we have developed Visualization Web contents, or what we call "Kotobanomori" in Japanese. It includes three main categories.
1st: Tree of Language, or "Kotobanoki" (Fig 1)
In this category, users develop a concept tree of a typed word. The concept tree is formed by a correlation chart, which includes the results of four search platforms: Twitter, Wikipedia, Google's search engine, and Yahoo and Google's suggested search results. The extracted keywords from the sentences make up nodes. The results are visualized as an actual tree, which can be related to in an intuitive way. Twitter's results are shown as leaves, Yahoo and Google's suggested results are shown as a trunk, Google's search engine's results are shown as roots, and Wikipedia's results are shown as the ground. Users can compare the results of the words of each search platforms all at once. The emotional valence, or intrinsic appeal or repugnance, of sentences from Twitter, from positive to negative, are obtained in 3 categories: "like - dislike", "joy - sadness", "anger - fear". A color is assigned and mapped, which is determined by a point scale system and the emotional, psychological impact of the color. So the colors of the leaves are determined by the emotional valence of the words.
2nd: Forest of Words or "Kotobanomori"
This category archives the users' search results of the tree of language. The screenshots of each result are gathered into a forest-like arrangement. The words, colors, and shapes are recreated and users can show the history of the results on a calendar and view other users' searches.
3rd: Root of Words, or "Kotobane"
This category visualizes the relationship between the users' search results of the tree of language in a correlation chart. Users can show the process of how words change and how they relate to each other. Also it shows the development of the word's emotional character. We assume that the word's emotional character reflects social customs and world events.
In order to show the effectiveness of our work, we analyze the web traffic to our site and the users' comments. The average visit duration of the web traffic shows that there was enough time for usage, and the number of visitors had amounted to more than 1,000 in 34 days. Here are a couple examples of users' comments, "I can find new relationships between words that I had not imagined. It really got me thinking." "The shape of the tree is cute. It is good for brainstorming."
From user comments and the amount of web traffic, we feel that people find our work useful as a way to show relationships between words on the web.
This work can be accessed by the following URL. It is limited to Japanese only.
[Key Words: information design, digital arts, spoken words, archive, data mining]
- 'Knowledge structuring with a topic map based on a philosopher's texts and journal databases'
Yu Inutsuka (Graduate School of Interdisciplinary Information Studies, University of Tokyo)
To address today's complex social issues, like environmental problems, it is necessary to apply the knowledge of more than one discipline. Besides the research to better organize information through computer programming, there are humanities scholars who cognitively reference and organize many fields, including natural and social sciences. With regards to social issues like environmental problems, scholars' selection of information in accordance with human ethical values is important but this work is difficult to share and be developed by others.
In this research, the author suggests a topic map based on philosopher's texts to share understanding of the theory and to build an information platform for further research. Using this methodology, the work of Augustin Berque has been chosen. Berque was originally a cultural geographer and has developed a theory called mesology to analyze human-environment interactions. He referred to many disciplines of arts and sciences, including philosophy, psychology, paleo-anthropology, ethology, neurosciences, etc, in developing this theory. However, because of its interdisciplinary nature, the framework of mesology is highly complex and difficult to understand. Prior research has only evaluated some particular concepts of mesology but dismissed how those concepts are supported by the reference to knowledge from multiple disciplines. In this study, to apply the organization of knowledge in his theory, first a topic map is build based on his texts. Topic maps have the advantages of visualization of the associations and the contents of topics; they have been used in the archival field and very recently in humanities text analysis. Through text analysis, the important concepts, people, and discipline names referenced by Berque are assigned as topics and connected with other related topics. After the topic map is constructed, the topics of disciplines will be linked to the journal database of that discipline. It will create a network of journal databases based on Berque's philosophical conception of humanity, society, and environment. The map will be available for researchers to evaluate, and they can make corrections in accordance with their own understandings. The network will work as an information platform to find the relevant and latest works produced by other disciplines and to engage in interdisciplinary research.
[Key Words: knowledge structuring, topic map, mesology]
- 'A Diachronic and Synchronic Investigation into the Properties of Mid-Rank Words in Modern Japanese'
Bor Hodošček (Tokyo Institute of Technology)
Hilofumi Yamamoto (Tokyo Institute of Technology / University of California, San Diego)The present study focuses on the role of mid-rank words in modern Japanese. Mid-rank words are defined as words having an average TF-IDF (term frequencyinverse document frequency) score. Mid-rank words are often overlooked for words with high TF-IDF scores, which act as reliable topic markers. Words with low TF-IDF scores are in turn seen as functional words and often discarded from analysis. Mid-rank words are thus words that do not lean heavily towards the two extremes of topic and function, but include a mixture of both. As such, their exact grammatical function is elusive and still relatively unknown.
In order to determine the properties of mid-rank words, we analyze midrank words on the synchronic and diachronic axes, based on time-series and register-varied modern Japanese corpora, respectively. Thus, the distributional properties of mid-rank words can broadly be compared to those of high- and low-rank words under various conditions.
Time-series data comprising n-grams sampled from blog posts is used to examine the role of mid-rank words in detecting rumor trends. We use Shewart's control charts method of identifying abnormal variations in time series data on n-grams with average TF-IDF scores. Having identified mid-rank words having abnormal frequency spikes, we use a word list classified according to semantic principles (bunruigoihyou) to uncover collocational patterns in time. For example, the frequency of the mid-rank word "America", which is otherwise a common word, was observed to spike around October 2008, which roughly corresponds to the period when the U.S. subprime mortgage crisis started to unfold. By observing the changes in collocations before, during, and after the frequency spike, it is possible to quantify what categories of words lead up to such a spike.
The Balanced Corpus of Contemporary Written Japanese is used to examine the role of mid-rank word collocation networks in the description of register differences. While common methods in corpus linguistics use keywords, which often correspond to words with a high TF-IDF, or function words, which often correspond to words with a low TF-IDF, to classify the register of documents, we focus on the distributional differences of mid-rank words in predicting register. We show that mid-rank words are less sensitive to specific topics or functional word usage, and can explain aspects of variation not discernible with topic or function words alone.
In conclusion, we show that mid-ranked words are crucial for a comprehensive account of any word or collocation, especially in the frame of thesaurus and collocation dictionary construction. We also identify areas for further research on the viability of mid-rank words in diachronic and synchronic studies, such as the need for more fine-grained classification of the mid-rank.
[Key Words: Corpus Linguistics, TF-IDF, diachronic analysis, Synchronic analysis, register]
- 'Case studies of archiving textual information on natural disaster: As a step for narrative visualization'
Akinobu Nameda (Senior Researcher, Ritsumeikan Global Innovation Research Organization, Ritsumeikan University)
Kosuke Wakabayashi (Senior Researcher, Ritsumeikan Global Innovation Research Organization, Ritsumeikan University)
Takuya Nakatsuma (Doctoral student, Ritsumeikan University)
Tomomi Hatano (Senior Researcher, Ritsumeikan Global Innovation Research Organization, Ritsumeikan University)
Shinya Saito (Senior Researcher, Ritsumeikan Global Innovation Research Organization, Ritsumeikan University)
Mitsuyuki Inaba (Ritsumeikan University)There is an emergent need to learn lessons from the experiences on the natural disaster. Considering that the natural disaster occurs, it is also important to convey the lessons to the next generation in order to prepare for the next natural disaster such as the strike of Great earthquake. Although numbers of archiving projects has collected large amount of descriptions, it is not easy to extract meaningful information from the piles of textual information. Thus, the present study explores an effective way to learn lessons from large amount of textual information.
We conducted two case studies that were visualizing textual information of the database on the Great earthquakes. Study 1 visualized the information database of the Great Hanshin-Awaji earthquake of 1995, which was created and published by the government of Japan (Cabinet Office, Government of Japan, 2006). In study 2, we created a visualization of textual information in a questionnaire survey data (Kashima city, 2012) on the Great East Japan earthquake. For the visualizations, we used KACHINA CUBE (KC) system (Saito, Ohno, & Inaba, 2009; Ohno, Saito, & Inaba, 2010) that is a web-based platform allowing us to store, plot and display textual information in three-dimensional space. In the study 1 and study 2, we used the KC system that contained 2D geographical area map and time periods in the three-dimensional space. Segmented textual information from the database was plotted as information fragments in the KC systems.
One of the outcomes of the visualization of the studies was that the users could view the quantitative distribution of segmented textual information in the geographical map and time periods. Comparing the number of information fragments across particular places and time periods, the users could reveal how textual information on the Great earthquake was accumulated and infer the reason of the distribution. In the study1, for example, we found that there were relatively less articles on Nagata area in the earlier period after the Great Hanshin-Awaji earthquake hit, although the area was seriously damaged by the earthquake.
Another outcome of the visualizations was that the information including future view will be contributing to learning lessons from the database. On the one hand, the visualization of the database on the Great Hanshin-Awaji earthquake was gaining the factual information on phenomena (Study 1). On the other hand, the visualization of the database on the Great East Japan earthquake allowed us to find the views for the future as well as the facts in the past (Study 2). Concretely in the visualization of study 2, we could see the link between past experience and future view, such as the demanding voice for making evacuation route known that was from the experience of the difficulty when the Great East Japan earthquake struck. In taking the perspective for extracting meaningful information and learning lessons, the outcome having the information on the future views is more useful to gaining meaningful story. With describing and organizing the experiences that are situated in local place and time, the archive visualizing meaningful story would be contributing to understanding human life.
[Key Words: digital archive, natural disaster, narrative, visualization, learning lessons]
References
Cabinet Office, Government of Japan. (2006). Information database of the Great Hanshin-Awaji earthquake. Retrieved October 5, 2011, from http://www.bousai.go.jp/1info/kyoukun/hanshin_awaji/index.html
Kashima city, Ibaraki, Japan. (2012, March). Survey report collection on the Great East Japan Earthquake. Planning division of Kashima city. Retrieved 17 October, 2012, from http://city.kashima.ibaraki.jp/info/detail.php?no=5671
Ohno, S., Saito, S., & Inaba, M. (2010). A platform for mining and visualizing regional collective culture. In T. Ishida (Ed.), Culture and Computing, LNCS (Lecture Notes in Computer Science), Volume 6259 (pp.189-199), Berlin: Springer.
Saito, S., Ohno, S., & Inaba, M. (2009, December). A platform for visualizing and sharing collective cultural information. Paper presented at the International Conference Digital Archives and Digital Humanities, Taipei, Taiwan. - 'Visualizing Proclus' Commentary on Plato's Timaeus with Textual Markup'
Hiroto Doi (Assistant Professor, University of Tsukuba)
Although a large number of studies have been made on digital humanities, few studies have attempted to apply digital humanities to philosophy or religious thought.
The present study concentrates on the method to visualize thought from a viewpoint of philosophy and religious studies. In order to do this, Proclus' Commentary on Plato's Timaeus will be focused. It is known as a representative work of Proclus (ca. 412-485), who is one of the greatest neoplatonist in late antiquity and head of the Academy. He comments on Plato's Timaeus which had a deep influence on western cosmology and cosmogony not only as a natural philosophy but as a theology. But the Commentary has a large volume and complicated description, a new method such as visualization is required to interpret Proclus' thought.
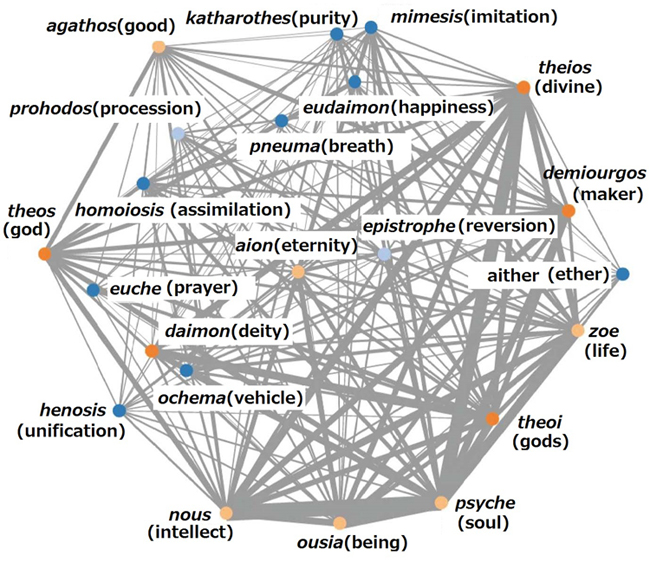
Before visualizing, the first to be needed is the analysis of the text. By using CATMA (Computer Aided Textual Markup and Analysis) which can handle ancient Greek text and can group together inflected Greek wordsby querying with tag (e.g. homoiosis which contains inflection and synonym), collocation of important concepts in the Commentary is calculated. The conceptssuch as homoiosis (assimilation), henosis (unification), psyche (soul), nous (intellect), euche (prayer), are chosen from Plato's and Proclus' religious theme "becoming like god". These words are based on my previous paper because the corpus analysis methods were not suitable for Proclus' philosophical text.
In order to visualize the Commentary, this study adopts D3.js (Data-Driven Documents), "a JavaScript library for manipulating documents based on data." The collocation datacalculated by CATMA's query builderare converted to a JSON (JavaScript Object Notation) format file, then the results of visualization is viewed bya web-browser which supports SVG (Scalable Vector Graphics). Among many types of graphs and charts offered by D3.js, this study uses force-directed graph which shows the relationship between nodes (sc. concepts) by lines (stronger line means stronger relationship) and mutual arrangement as below. Though further inquiry into correlation parameters such as Pearson product-moment correlation coefficientby using SPSS was tried, the method for visualization is on the way.
This force-directed graph shows that the concepts concerning "becoming like god" in the Commentary connect each other closely and form a complex network, and that religious concepts (e.g.euche (prayer), katharothes (purity), henosis (unification)) are not alienated from important concepts (e.g. ousia (being), psyche (soul), nous (intellect), zoe (life)) in Proclus.
But this visualization also has difficulties. Though the nodes are only 22 in number, this graph is highly complicated to grasp an interrelationship between concepts and the strength of the lines only depends on the number of occurrence, the importance of the connection is not shown.
A further study and sophistication of this visualization of thought should be conducted. But in my poster presentation, this approach will be demonstrated with a laptop computer as a work-in-progress.
[Key Words: visualization, markup, philosophy, religious thought]
Bibliography
Mike Dewar, Getting Started with D3: Creating Data-Driven Documents, Sebastopol, O'Reilly, 2012.
E. Diehl (ed.), Procli diadochi in Platonis Timaevm commentaria. 3 vols., Leipzig, Teubner, 1903-1906.
E. R. Dodds, The Elements of Theology: A Revised Text with Translation, Introduction, and Commentary, Oxford, Clarendon Press, 1963 (Second Edition).
Hiroto Doi, "Spirituality and Religious Thought in Ancient Greek", in: Yoshio Tsuruoka and Hidetaka Fukasawa (eds.), Spirituality and the History of Religions, Vol. II, Tokyo, Lithon, 2012.
Manuel Lima, Visual Complexity: Mapping Patterns of Information, New York, Princeton Architectural Press, 2011. - 'Possibilities of the Data Visualization for Humanities in a Web Browser : A Demonstration of the KACHINA CUBE Version.3'
Shinya Saito (Senior Researcher, Ritsumeikan Global Innovation Research Organization, Ritsumeikan University)
This poster presentation focuses on the KACHINA CUBE version.3 (KC ver.3) system[1], an original Web-based visualization tool. Those who visit the poster presentation can operate the system on the spot.
The first part of the presentation explains the background of the development of KC system. "Visualization" can be divided into two categories[2]. One is "scientific visualization", and the other is "information visualization". KC's visualization belongs to the latter. To be more precise, it belongs to its sub-category called "Infographics". In order to develop the methodology of the Inforgraphics further, this research focuses on the following three points. The first point is to automatically reflect the current status of databases, as the CMS (Contents Management System) does. The second is to make the user can operate graphics with interactive visualization. The last point is to use 3-D CG on the browser efficiently.
The next part discusses the purpose of the development. KC's visualization aims to create a sort of "space nature" to a dataset. This can give us new attitude towards various data. Moreover it can support us to construe a large amount of information.
As for the implementation methodology of the KC (version.2), it has an information-viewer, cube geometry to achieve the above-mentioned purpose. Using this, we can put the map that we made into the bottom of cube. This map decides the position of information in two dimensions, and the third dimension decides the time flow of the information. With this KC system, we can store, plot, and display arbitrary information in itsviewer. In the Humanities research, it is essential to sort data out along the timeline, which the KC can visually support with its 3-D CG. Actually, the KC has been helping researching local history and analyzing development of some industries.
Moreover I will explain the difference between KC ver.3 and the earlier version KC ver.3 has some innovative functions for data visualization in a Web browser. In the end, we will discuss how effective the application of KC could be. Our past system operation made two types of merits of KC clear. In other words, KC proves its effectiveness as both a presentation tool and an analysis method.
[Key Words: Visualization, Inforgrafics, CMS (Contents Management System), 3D-CG]
Bibliography
[1] Shinya Saito. "Web Technology and Visual Expression: From a Point of View of e-Research", In Inaba, M (ed.), Digital Humanities Research and Web Technology, Nakanishiya Publishing, 2012, pp.197-214.
[2]Riccard Mazza. Introduction to Information Visualization. Springer, 2009. - 'Situated and Collaborative Learning in 3D Metaverse: A Case Study of Computer-Mediated Cultural Exchange between Japan and Hawaii
Michiru Tamai (Doctoral Program in Policy Science, Ritsumeikan University, Digital Humanities Center for Japanese Arts and Cultures (DH-JAC))
Mitsuyuki Inaba (Professor, Digital Humanities Center for Japanese Arts and Cultures (DH-JAC), Ritsumeikan University)
Koichi Hosoi (Professor, Digital Humanities Center for Japanese Arts and Cultures (DH-JAC), Ritsumeikan University)
Akinori Nakamura (Professor, Digital Humanities Center for Japanese Arts and Cultures (DH-JAC), Ritsumeikan University)
Masayuki Uemura (Professor, Digital Humanities Center for Japanese Arts and Cultures (DH-JAC), Ritsumeikan University)
Ruck Thawonmas (Professor, Digital Humanities Center for Japanese Arts and Cultures (DH-JAC), Ritsumeikan University)This research introduces a case study of the computer-mediated cultural exchange between Hawaii and Japan on the Internet. It is an outcome of our ongoing research efforts on implementing 3D Metaverse environment for preserving and sharing Japanese traditional culture.
3D Metaverse is a platform for constructing immersive virtual spaces with digitized objects and architectures on the Internet. An avatar, or a controllable virtual character in the space, enables the visitors to the 3D space participating in embodied social interaction with other avatars.
These features of the Metaverse are beneficial to the implementation of learning platforms for those who have difficulties to visit a foreign country or distant area. Therefore, it opens the door to new way of cultural learning.
Also it provides powerful platform for inheriting and sharing traditional tangible and intangible cultural heritage from socio-cultural perspective, which was difficult to provide by conventional web-based e-Learning environments.
First, we demonstrate our Metaverse environment in SecondLife (SL), which is the most popular Metaverse infrastructure. The environment has been constructed based on the results of the questionnaire survey to international students. The space includes Japanese tangible cultural properties such as Shinto shrine, Buddhism temple, and Noh stage. It also has virtual museums for Kimono costume or Yuzen textile design. Various intangible cultural heritages are also digitized and preserved in the space.
Second, we provided a collaborative environment where students will acquire and practice the necessary communication skills under the constructivist principles of situated learning and collaborative learning by the SL. In the experiments, Hawaiian and Japanese students interacted, and exchanged their questions, impressions, or interpretations on traditional culture and custom on each virtual island. We analyzed their interaction and learning process in a virtual world. In the process, the situational cultural learning between newcomers and old timers was enabled.
Finally, we discuss the advantages and limitations of the learning process in our Metaverse platform in terms of situated learning and collaborative learning.
[Key Words: Situated Learning, Collaborative Learning, Metaverse, e-Learning, Japanese Culture]
- 'Spatial Analysis and Web-based Application of "Large-scale Maps of Kyoto City"'
Naomi Akaishi (Ph.D. Geography, Ritsumeikan University, Japan)
Toshikazu Seto (Center for Spatial Information Science at the University of Tokyo)
Yukihiro Fukushima (Kyoto Prefectural Library and Archives)
Keiji Yano (Professor, Ritsumeikan University)This paper analyzes how the City of Kyoto used its land in the Modern period and explores applicability of web maps with an example of digitalized "Large-scale Maps of Kyoto City (Kyoto-shi meisai-zu)". Made between 1927 and 1951 for fire insurance purposes, these maps contain various kinds of building-related information necessary to prevent fire.
GIS database of "Large-scale Maps of Kyoto City" is composed of about 160,000 building polygons. What the maps tell us is that, while an average building occupied approximately 93 square meters, about 13% of all the buildings were much smaller, 30 square meters or less each, whose shapes indicated that they must be tenement houses. The maps include about 147,000 buildings with information about their usage and the number of stories on, which are set to work as point data.
The majority of the buildings were one or two stories high, which accounted for more than 80% of the total. High-rise buildings of five stories or more were factories and theatres, which must be regarded as major landmarks during the time period between 1945 and 1955 after WWII. It is worth noticing that descriptions and colors on the maps indicate how buildings were used, most of which were employed for public facilities such as houses, offices, factories, temples and shrines, and schools. Some exceptions include textile-related buildings, pleasure quarters, and mansion houses, which means that the maps functioned as residential ones.
Many of the buildings depicted in "Large-scale Maps of Kyoto City" no longer exist. We publish the Maps' digital images through the ArcGIS online, overlaying them on current housing maps. This service is available not only on the web page but also on iOS or Android dedicated mobile applications downloaded. With this portability, we have started using the maps as a tool to inspire local residents' memories and for social events that involve walking town. In the future, we hope to include more detailed information, such as photographic images of major facilities and descriptions of major events.
[Key Words: "Large-scale Maps of Kyoto City", GIS, digitalization, landscape reconstruction, modern Kyoto]

